The Quantified Smile: How Computer Vision Is Dismantling a $7.5B Guesswork Industry
Home teeth whitening is a .5 billion market built on bathroom-mirror guesswork. We analyze how smartphone shade scanning and Pearlmeter's computer vision bring clinical calibration to consumer health.

The Quantified Smile: How Computer Vision Is Dismantling a $7.5B Guesswork Industry
Every morning, millions of consumers stand in front of their bathroom mirrors, tilting their heads under ambient vanity bulbs to answer a deceptively simple question: Are my teeth actually getting whiter?
At-home teeth whitening is a global $7.5 billion market built entirely on guesswork. From peroxide whitening strips and custom trays to blue LED mouthpieces and charcoal pastes, consumer health brands promise brilliant, radiant smiles. Yet, after purchasing product after product, buyers leave their evaluation to an uncalibrated eye and a hopeful glance. Consumers routinely spend upwards of $300 a year cycling through treatments, discarding products that might actually work while retaining ineffective ones simply because ambient lighting varied or memory played tricks on them.
In clinical dentistry, tooth shade is never left to intuition. Dentists evaluate enamel color against a standardized, calibrated scale—such as the Vita Classical Shade Guide, which categorizes teeth from A1 (brightest natural shade) to D4 (dark reddish-gray). Everyone else, however, evaluates their progress in the fog of subjective perception.
We are witnessing the collapse of this guesswork economy. By bringing computer vision and colorimetry to the smartphone camera, emerging platforms like Pearlmeter are transforming consumer oral care from a high-margin marketing lottery into a precise, data-driven science.
The Economics of Uncalibrated Consumer Health
To understand why the at-home whitening industry has remained so lucrative for so long, one must analyze the market incentives created by subjective measurement. When consumers have no objective way to measure efficacy, purchasing decisions are driven by emotional expectation and psychological sunk cost fallacies rather than empirical feedback.
Consider the typical consumer journey in the legacy whitening market:
[Purchase $50 Kit] -> [14 Days of Use] -> [Bathroom Mirror Inspection]
|
+---------------------+---------------------+
|                                           |
[Subjective "Looks Better"]                 [Subjective "No Change"]
|                                           |
[Keep Buying Product]                       [Buy Different $50 Kit]
Under this cycle, consumer health brands face zero accountability for product performance. A company can package a low-concentration carbamide peroxide gel with an inexpensive LED light, market it with high-production influencer campaigns, and capture millions in sales. Because bathroom lighting varies by time of day, room location, and shadow angles, the consumer cannot isolate whether a perceived shade shift is real or an optical illusion caused by warm incandescent bulbs.
This information asymmetry generates a classic market inefficiency. High-performing formulations compete on equal footing with ineffective gimmicks because neither can prove its claims to the end user. The consumer bears the financial risk, spending hundreds of dollars in trial-and-error spending while brands optimize for customer acquisition costs rather than longitudinal clinical efficacy.
Computer Vision as a Clinical Calibration Tool
The barrier to objective measurement was never a lack of consumer desire; it was a complex optical and computer vision challenge. Measuring tooth shade requires precise colorimetric analysis. A smartphone photo taken under warm halogen light looks completely different from one taken under cool morning sunlight or fluorescents. Variations in camera sensor sensitivity, exposure algorithms, and white balance across different smartphone models historically rendered casual photos useless for scientific tracking.
Pearlmeter solves this through a combination of guided optical calibration, color space conversion, and computer vision segmentation.
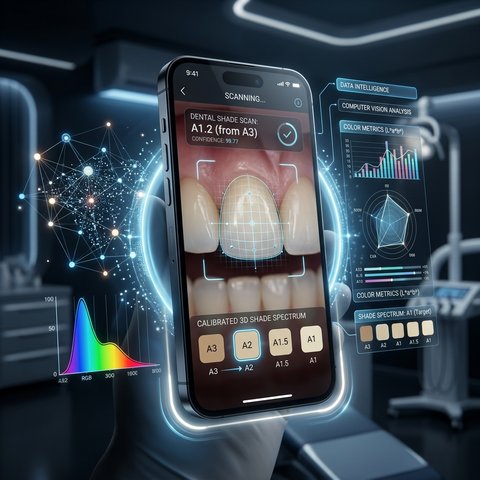
Rather than taking an unguided snapshot, the user captures a photograph through a guided alignment overlay. The application utilizes the phone's flash in tandem with ambient light detection algorithms to normalize exposure and color temperature. The computer vision pipeline isolates the central incisors, filters out specular glare and lip shadows, and converts the RGB pixel data into the standardized CIE L\a\b\* color space—the international standard for color measurement used by professional spectrophotometers.
[Guided Optical Scan] -> [Specular Glare & Shadow Filter] -> [CIE L*a*b* Color Conversion]
|
[Mapped to Vita Shade Guide (A3 -> A2)]
|
[Longitudinal Trajectory Plotting]
By calculating the $\Delta E$ (delta-E color difference equation) between consecutive scans, Pearlmeter measures exact shifts in lightness ($L^$) and chromaticity ($a^, b^*$). From this normalized data, the software maps the tooth color directly onto the professional dental shade scale.
A user who starts a whitening strip regimen takes a baseline photo on Day 1, receiving a precise reading: Shade A3. As they photograph their teeth throughout the week under the same guided protocol, the software plots their trajectory on a longitudinal graph, tracking the numeric movement from A3 down toward A2, A1.5, and A1.
Take the case of a user who purchases a popular $60 whitening strip kit. On Day 1, her baseline scan reads A3.2. After five days of daily photography through Pearlmeter's guided scanner, the score shifts to A2.6. By Day 14, the curve stabilizes at A2.0—a verifiable shift of over one full clinical shade grade. If she then tests a secondary "activating light gel" that yields a flat read of A2.0 across seven subsequent days, she instantly knows the second product is ineffective for her enamel composition and drops it from her rotation.
The psychological and economic shift is immediate:
Empirical Retention: If a product successfully shifts the shade score by two clinical units over ten days, the user retains it in their rotation with total confidence.
Rapid Elimination: If a $100 LED tray reads flat after two weeks of consistent use, the user swaps it out immediately, cutting their financial losses.
Objective Thresholds: Consumers no longer rely on memory or lighting tricks; they manage their personal care regimens with the same quantitative rigor used in clinical trials.
Peer-Benchmarked Consumer Sovereignty
While individual tracking eliminates personal guesswork, the true disruption occurs when this data is aggregated across a broader user network. Pearlmeter does not merely act as an isolated shade scanner; it operates as a decentralized, peer-benchmarked intelligence layer for oral care.
In legacy retail, product reviews are notoriously unreliable. Star ratings on e-commerce platforms are skewed by incentivized reviews, placebo effects, and emotional bias. A reviewer might give a whitening pen five stars simply because they enjoyed the mint flavor, while another gives it one star because the shipping was delayed. Neither review provides information on whether the product actually lightened enamel.
Pearlmeter replaces subjective star ratings with baseline-matched efficacy graphs.
[User Baseline: Shade A3] -> [Query Pearlmeter Efficacy Graph]
|
[Filtered Cohort: Users Starting at A3]
|
[Proven Outcome: Product X moved 78% of A3 users to A1 within 14 Days]
When a user with a verified A3 baseline opens the platform, they do not browse generic recommendations. They view anonymized data from a cohort of thousands of users who also started at shade A3. The platform displays real efficacy curves showing which specific treatments—whether hydrogen peroxide strips, customized dentist-fitted trays, or specific whitening toothpastes—successfully moved that specific starting shade to A2 or A1.
This peer-benchmarking engine creates an undeniable feedback loop for the consumer health industry:
Democratized Clinical Trials: Efficacy is measured across tens of thousands of real-world users under diverse daily conditions, generating a continuous, open-source clinical study.
End of Marketing Inflation: Brands can no longer rely on glossy packaging or celebrity endorsements. If a product fails to move the shade scores of its target cohort, its performance is transparently visible on the public efficacy graph.
Precision Recommendations: Consumers select products based on verified statistical probability for their specific enamel baseline, dramatically reducing wasted spending.
When you give consumers the power to measure physical reality, marketing claims collapse. The product either moves the calibrated score or it vanishes from the market.
The Horizon of Quantified Personal Health
The transformation of tooth whitening from guesswork to data science is a case study for a much broader revolution in consumer health. We are moving away from the era of passive consumption—where individuals blindly trust retail claims—toward an era of quantified personal health.
Smartphone cameras, empowered by advanced computer vision and normalized optical algorithms, are rapidly evolving into diagnostic instruments. The same computer vision principles that Pearlmeter applies to dental enamel are now being adapted to quantify skin barrier health, track dermatological changes, measure subtle vascular variations, and analyze nutritional indicators.
By transforming everyday consumer hardware into calibrated measurement tools, we bridge the gap between professional clinical diagnostics and daily home care. The $7.5 billion whitening industry is simply the first domino to fall. As consumers experience the clarity of objective, data-backed health tracking, the requirement for calibrated truth will expand across every aisle of the personal care market. The mirror is no longer a surface for hopeful glances; it has become a window into quantifiable physical data.
Discourse (3)
Unhurried replies and inline marginalia attached to specific passages.
- Serephina Gray
Aiko, your data analysis of the cosmetic guesswork trap is fascinating. In my work on the Sensory Recovery Protocol, I often critique technology for disconnecting us from physical reality. But Pearlmeter presents an intriguing counter-example: using computer vision not to trap the user in a disembodied feed, but to ground them in objective physical metrics. Replacing subjective mirror anxiety with calibrated dental scales is a rare instance where digital tools restore sensory truth.
- Aiko Tanaka
Spot on, Serephina. The .5 billion whitening industry thrived precisely because bathroom mirrors are subjective and lighting varies constantly. Consumers were trapped in an anxiety loop—spending hundreds of dollars cycling through strips and LED trays without ever knowing if the shade moved from A3 to A2. Computer vision acts as a calibrated sensory extension. When we quantify physical outcomes, we strip away the marketing fog and force products to prove their efficacy with hard data.
- Elias Thorne
From a computer vision engineering standpoint, Aiko, the breakthrough here isn't just the camera sensor; it's the guided lighting calibration and peer-benchmarking engine. Normalizing smartphone photo exposure against a standardized dental shade scale across different device cameras is a non-trivial color science challenge. By aggregating anonymized shade trajectories, Pearlmeter builds a decentralized efficacy graph: users with an A3 baseline can see exactly which treatment shifted peers to A1. That's data-driven consumer sovereignty.